AI Weekly Scanner Performance Check
63% of our scanner picks gained 15%+ within 45 days. Here's the full breakdown across 17 weeks.
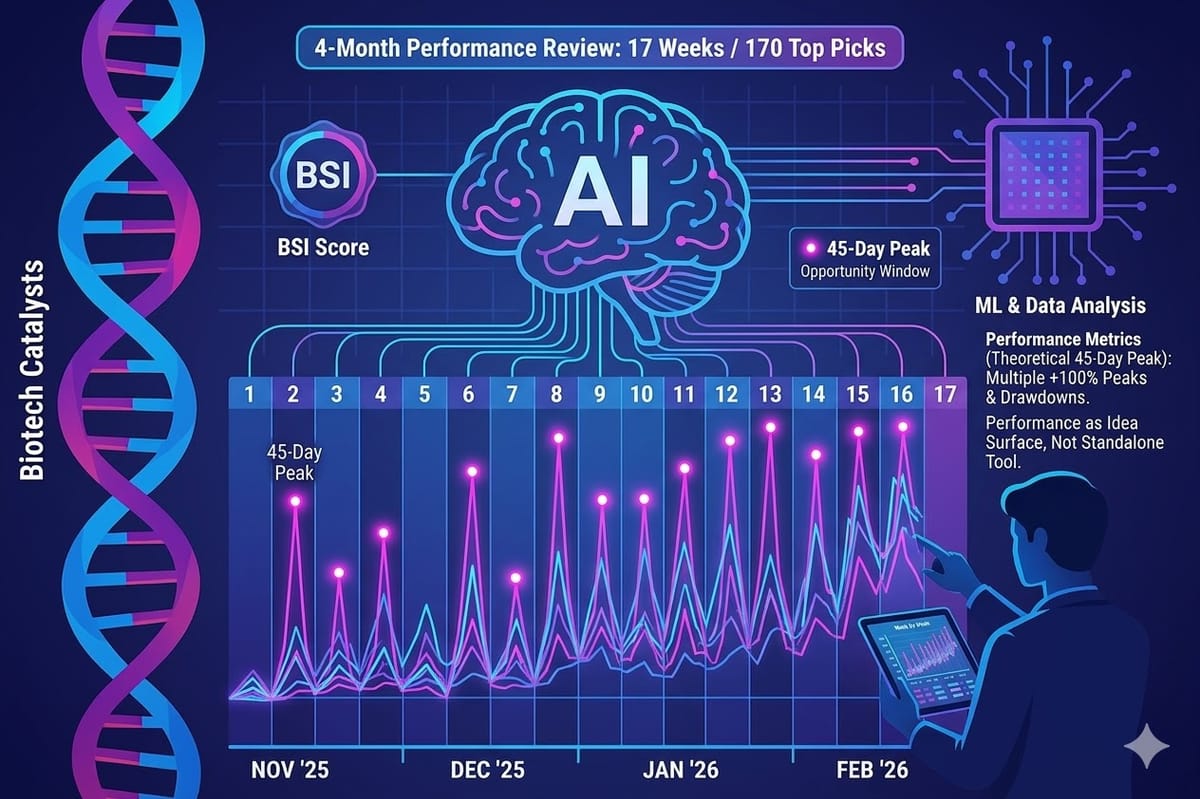
I started publishing the weekly AI Catalyst Scanner in the first week of November 2025. Now that we have over four months of data across 17 weeks, it's time to share actual performance results.
For those unfamiliar with how our scanner works: it starts with a machine learning model trained on 15+ years of historical price action data surrounding actual historical biotech catalysts. The model first filters for tickers with estimated catalysts within the next 45 days, weighting technical and catalytic strength. From there, an AI layer researches each candidate across several dimensions — management quality, financial health, pipeline depth, scientific strength, competitive landscape — and assigns a rating. The final BSI Score combines the ML signal with the AI assessment to rank the top opportunity ideas each week.
The whole purpose of the scanner has always been to surface ideas for your own due diligence — specifically for catalyst-driven swing trades, not long-term holds. These setups are inherently volatile, and the performance data below makes that abundantly clear.
A few notes before you scroll down:
What's tracked: Only the top 10 picks from each weekly article. 170 picks across 17 weeks.
What's excluded: CLSD (delisted — my data source cannot fetch OTC tickers) and HELP (price data was inconsistently reported across the article in both CAD and USD).
Reverse Split Adjusted: Stock prices of tickers that underwent reverse splits have been normalized to prevent skewing the data.
What "45-Day Peak" means: This is the highest price reached within 45 days of the pick date. It represents the theoretical best exit — nobody times the exact peak. Think of it as the opportunity window, not a guaranteed return.
What this data does NOT prove: That the scanner is a reliable standalone trading tool. It is not. What it does show is that catalyst-driven biotechs tend to move — often sharply — within the expected window. Capturing that move requires your own research, a clear price target, and a strict stop-loss. Without those, the same volatility that creates +100% peaks can also creates -80% drawdowns.
The performance tracker below is best viewed on desktop or tablet.
— of our picks gained 15%+
within 45 days
Tracking the top 10 picks from every weekly BioStockInfo catalyst scanner since October 2025.
Catalyst-driven biotechs spike and fade. The scanner identifies the spike window — not long-term holds. — of picks gained at least 15% within 45 days, while only — are currently green. The gap between these numbers is the exit window — and the core thesis behind the scanner.
| Week ↕ | Date ↕ | # ↕ | Curr Avg ↕ | Curr WR ↕ | 45d Peak Avg ↕ | 45d ≥15% ↕ | 45d Avg Loss ↕ |
|---|
| Week | # | Ticker | Pick $ | BSI | Current $ | Current % | 45d Peak % | 45d Low % | Max Gain % | Max Loss % |
|---|
Disclaimer
The information provided on this website is for informational purposes only and should not be construed as
financial, investment, legal, or professional advice. While efforts are made to ensure accuracy, no guarantee
is given regarding completeness or reliability. Visitors should conduct their own research or consult a qualified
advisor before making any decisions. External links are provided for convenience and do not imply endorsement. Past performance does not guarantee future results.